

Main Text starts here.
Financial Information
Latest Financial Results and Forecast

Latest Financial Results
Q4 FY2025 Consolidated Financial Results announced on May 15, 2026
Net income* reached a record high of ¥ 168.7 billion, which increased by 36.7% year on year, as a result of decrease in the increased burden of regular policy reserves in the first year of new policies and an increase in positive spread, etc. caused by an improvement in the market environment, etc.
Adjusted profit reached a record high of \ 171.5 billion, which increased by 17.7% year on year, as a result of excluding the decrease in the increased burden of regular policy reserves in the first year of new policies, etc., from net income.
-
Net income 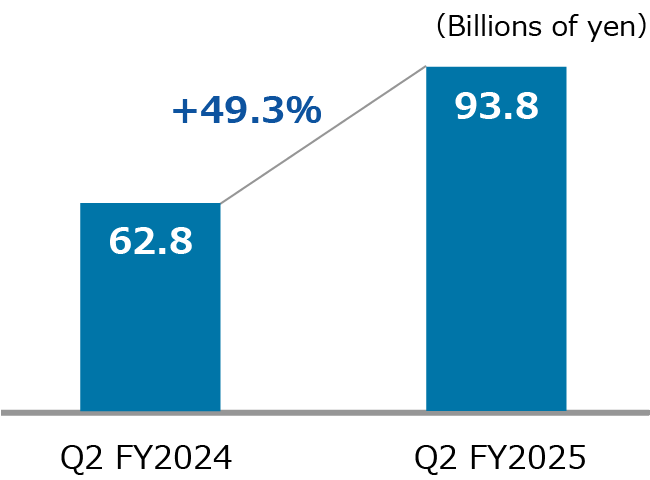
-
Adjusted profit 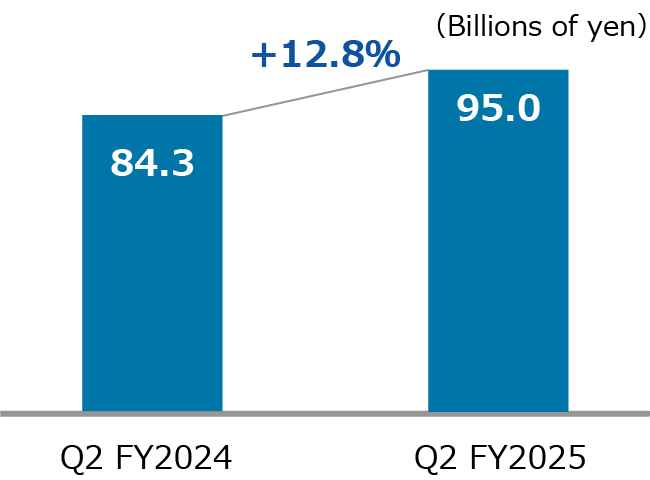
- "Net income" indicates net income attributable to Japan Post Insurance.
The number of new policies for individual insurance decreased by 46.1% year on year to 428 thousand due to the impact of the decrease in sales of lump-sum payment whole life insurance, etc.
The number of policies in force decreased by 5.8% to 17,725 thousand from the end of the previous fiscal year. We continue to aim for a swift turnaround and recovery in the new category*.
-
Number of New Policies
(Individual Insurance)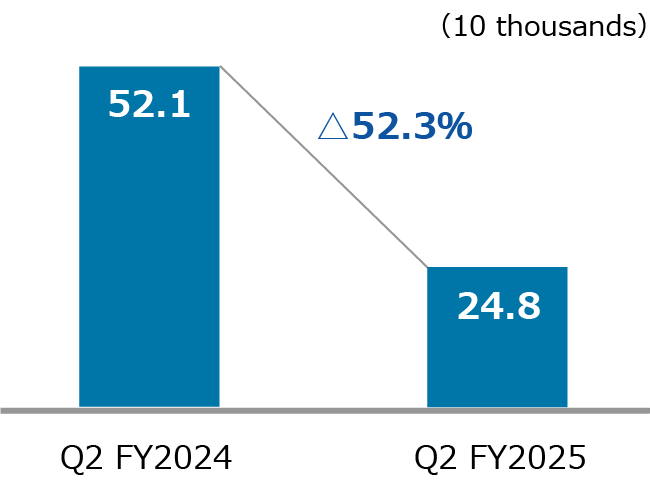
-
Number of Policies in Force
(Individual Insurance)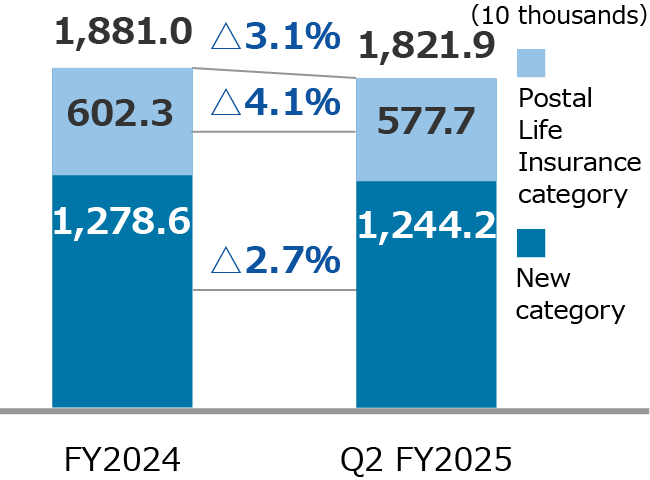
- “New category” shows individual insurance policies underwritten by Japan Post Insurance. “Postal Life Insurance category” shows postal life insurance policies reinsured by Japan Post Insurance from Organization for Postal Savings, Postal Life Insurance and Post Office Network.
For details, please check the latest ‘Conference Call Material’ and ’Performance and Financial Data’
Financial Results Forecast
FY2026 Consolidated Financial Results Forecast announced on May 15, 2026
Although there are impacts from a decrease in policies in force, etc., adjusted profit is forecast to be approximately ¥ 155.0 billion, as investment income is expected to remain strong.
(Billions of yen)
| FY2025 (Revised forecasts) *revised on Nov 14, 2025 |
FY2025 | Achievement | FY2026 (Forecast) |
|||
|---|---|---|---|---|---|---|
| Ordinary income | 5,740.0 | 5,625.7 | 98.0% | 5,130.0 | ||
| Ordinary profit | 260.0 | 271.9 | 104.6% | 250.0 | ||
| Net income | 159.0 | 168.7 | 106.2% | 141.0 | ||
| Adjusted profit | Approx 162.0 | 171.5 | 105.9% | Approx 155.0 | ||
[Definition of adjusted profit (to be introduced from FY2024)]
In order to partially adjust for the effect unique to life insurance companies whose net income is reduced in the short term as new policies increase, from FY2024 we introduce “adjusted profit” taking into account the adjustment for the increased burden of regular policy reserves after tax in the first year of new policies.
In addition, We will recognize goodwill from our investment in Daiwa Asset Management Co. Ltd. from Q3 FY2024. The definition of adjusted profit has been revised to add back the amortization of this goodwill.
| Adjusted profit (Source of shareholder return) |
= | Net income | + | Burden of regular policy reserves in the first year | + | Amortization of goodwill |
Relate starts here.
IR information