Initiatives for Climate Change
In April 2019, we announced our support for the recommendations of the Task Force on Climate-related Financial Disclosures (TCFD) established by the Financial Stability Board (FSB).
We recognize that climate change issues pose both risks and opportunities for the company, and that we need to address them company-wide. As one of the basic policies of our Medium-Term Management Plan, we have set the promotion of ESG management (contribution to solving social issues) and are working to solve social issues related to sustainability, including climate change issues.
Going forward, we will further promote our existing initiatives related to climate change and work on further information disclosure.
| Recommended Disclosure Items for TCFD Recommendations | |
|---|---|
| Governance | Disclose the organization's governance around climate-related risks and opportunities. |
| Strategy | Disclose the actual and potential impacts of climate-related risks and opportunities on the organization's businesses, strategy, and financial planning where such information is material. |
| Risk management | Disclose how the organization identifies, assesses, and manages climate-related risks. |
| Metrics and targets | Disclose the metrics and targets used to assess and manage relevant climate-related risks and opportunities where such information is material. |
(Source) Final Report: Recommendations from the Task Force on Climate-related Financial Disclosures, TCFD
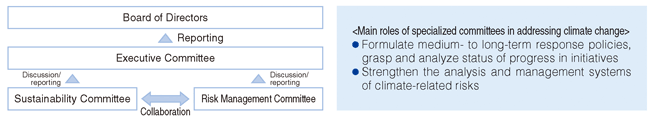
Governance
At the Company, the Sustainability Committee, chaired by the Executive Officer in charge of the Sustainability Promotion Department, and the Risk Management Committee, chaired by the Chief Risk Officer (CRO), review and discuss various issues related to climate change.
The status of examinations and discussions is reported to the Executive Committee, and particularly important issues are discussed at the Executive Committee and decided by the President, CEO, Representative Executive Officer. In addition, reports are made to the Board of Directors on a regular basis, and a framework has been established in which the Board of Directors appropriately monitors the status of climate change response and, as necessary, supervises related policies, targets, strategies, and plans.
Notably, for performance-linked stock compensation for executives, we have set the degree of achievement of ESG indicators as a metric and set targets such as the implementation status of GHG emissions reduction initiatives.
[Results for FY2026/3 (reports to the Board of Directors)]
- Frequency of reporting to the Board of Directors: Once a year
Strategy
Risks and opportunities that climate change poses to our business
We recognize the impact (risks and opportunities) of climate change on the Company in both as a life insurance company and an asset owner, as follows.
Life Insurance Company
| Type | Content | Timeline of impact |
|---|---|---|
| Physical Risks | Rise in insurance claim payment due to increased damage from natural disasters, etc. | Short to long term |
| Rise in insurance claim payment due to Changes in mortality and morbidity rates over the medium to long term due to the impact of rising average temperature and abnormal weather | Medium to long term | |
| Transition Risk | Damage to the Company's reputation among society, investors and other stakeholders due to a deemed failure to take adequate measures to address climate issues | Short to long term |
| Opportunity | Changes in consumers' insurance needs such as rising demand for products and services related to maintaining health, etc. | Medium to long term |
Asset Owner
| Type | Content | Timeline of impact |
|---|---|---|
| Physical Risk | Impaired value of invested assets due to expanding loss incurred by investees upon increased damage from natural disasters, etc. | Short to long term |
| Transition Risk | Impaired value of investees due to the impact of changes in regulations in line with the shift to a low-carbon society, stricter regulations and changes in consumer preference | Short to long term |
| Opportunity | Expanding green finance market and increasing investment opportunities including investments in renewable energy business (infrastructure) | Short to long term |
(*1) In identifying the risks and opportunities mentioned above, we disclose risks and opportunities with high degree of impact based on their importance to the Company's business after identifying large and small potential risks.
(*2) We assume that the timeline of impact will be as follows: short term: 5 years, medium term: 15 years, long term: 30 years.
Analysis of the impact of climate change on our business
The following scenario analysis was conducted to understand the impact of climate change on our business. We will continue to conduct scenario analysis to improve the accuracy of the analysis, and will take steps toward decarbonization and risk management based on the results of this analysis.
Analysis of the impact of climate change on the Company's Life Insurance Business
Increase in the number of individuals who suffer from heat stroke due to higher temperature in summer, increase in the number of patients who suffer from tropical infectious diseases due to the expansion of areas where vector mosquitos of infectious disease can be active, etc., and damages to health due to increased and prolonged damage from flooding, etc., can be considered to have an impact on the Company's life insurance business (claims payment) as events that could lead to a significant increase in the amount of claims payment.
In the fiscal year ended March 31, 2026, we conducted a quantitative analysis of the increase in heat stroke deaths and expanding damage of tropical infectious diseases conducted in the last fiscal year. As a result, we confirmed that the increase in claim payments will have a limited impact on our financial soundness, given the extremely small amount compared to the Company's actual death benefit payments and the fact that we are able to make payments from the policy reserves we have built up in preparation for future payments.
We believe that there are many challenges regarding the accuracy and reliability of our analysis of the impact of climate change on the Company's life insurance business, as there are no generally established measurement models and climate change itself has a high degree of uncertainty, such as its occurrence over a long period of time. In the future, we will continue our efforts to understand risks through analysis such as further research, stress testing, etc.
(i) Increase in heat-stroke deaths
We have made an estimate projecting an increase in heat stroke deaths in Japan assuming an increase in average temperatures throughout Japan, when the SSP5-8.5*1 scenario based on the Sixth Assessment Report of IPCC*2 is applied as the temperature. As a result of analysis by age group, we estimate that insurance claims and other payments will increase by approximately \4.0 billion on a cumulative basis from the fiscal year ending March 31, 2032 to the fiscal year ending March 31, 2051, particularly in the elderly age group.
(ii) Expanding damage of tropical infectious diseases
Based on an estimate that rising temperatures will cause infectious diseases spread by mosquitoes to be active over larger areas and periods, we analyzed the increase in insurance claims and other payments due to mosquito-borne tropical infectious diseases (dengue fever and malaria). We applied the SSP5-8.5*1 scenario based on the Sixth Assessment Report of IPCC as the temperature increase and, referring to recent outbreaks of tropical infectious diseases in tropical regions and the sanitary conditions in Japan, assumed that dengue fever would spread in Japan, resulting in hospitalization or death of customers. As a result, assuming that the disaster will occur every year, we calculated that the increase in insurance claims and other payments would be up to around ¥20.0 billion on a cumulative basis over the 20-year period from the fiscal year ending March 31, 2032 to the fiscal year ending March 31, 2051.
(*1) Intergovernmental Panel on Climate Change, or IPCC, is an intergovernmental organization established in 1988 by the World Meteorological Organization (WMO) and the United Nations Environment Programme (UNEP).
(*2) The SSP5-8.5 is one of the SSP scenarios. The SSP scenarios are scenarios that combine five shared socioeconomic pathways (1. Sustainability, 2. Middle of the Road, 3. Regional Rivarlry, 4. Inequality, and 5. Fossil-fueled Development) with emission scenarios that assume the future concentration of greenhouse and other gases in the atmosphere due to human activities.
Analysis of the Impact of Climate Change on the Company as an Asset Owner
(1) NGFS's Climate Scenarios Analysis
We expect that the assets owned by the Company will be affected by changes in the economic environment as we transition to a decarbonized society. We have analyzed how our assets would be affected by these changes by 2050 under several financial market scenarios*1 and carbon price scenarios published by the Network of Central Banks and Supervisors for Greening the Financial System (NGFS*2).
We believe that there are many challenges regarding the accuracy and reliability of our analysis of the impact of climate change on the Company's asset management, as there are no generally established measurement models and climate change itself has a high degree of uncertainty, such as its occurrence over a long period of time. In the future, we will continue our efforts to understand risks through analysis such as further research, stress testing, etc.
(i) Scenario analysis related to our investment income
We analyzed the impact of climate change on our interest margin under the NGFS scenario (financial market scenario). We used a scenario in which long-term interest rates in Japan and abroad increase moderately, and therefore, we expected an increase in interest gains from our holdings of yen-denominated interest bearing assets such as Japanese government bonds*3.
(ii) Scenario analysis for assets owned by the Company
Under the NGFS scenario (carbon price scenario), we analyzed the decline in the value of securities (the increase in the future carbon cost burden of investee companies). In our portfolio, especially for bonds with long maturities of over 10 years, a certain decline in value was expected*4. In practice, we believe that the impact on our financial condition will be limited, given the fact that the deterioration in the earnings of investee companies and the decline in their market value will surface gradually and that the assets we own can be sold during the course of our investment.
(*1) Scenario published in 2022 (scenario model: REMIND-MAgPIE 3.0-4.4). The scenario does not take into account the impact of the recent war in Russia and Ukraine and the resulting energy crisis.
(*2) Network for Greening the Financial System, or NGFS, is an international network of central banks and financial supervisors to examine financial supervisory responses to climate change risks. The Financial Services Agency and the Bank of Japan joined the network in June 2018 and November 2019, respectively. The scenarios used are: (i) Current Policies scenario in which global warming will progress as a result of no further action on climate change being be taken by countries than they are currently implementing (global temperature will rise by more than 3°C), (ii) Net Zero 2050 scenario in which countries will achieve the 2050 carbon neutrality and 1.5°C temperature rise targets in a coordinated and systematic manner; and (iii) Delayed Transition scenario, in which climate change measures are taken rapidly after 2030.
(*3) This analysis does not take into account increases in business expenses due to factors such as rise in inflation rates.
(*4) If the dataset necessary for calculation (GHG emissions, etc.) is not available, it is not included in the analysis. The impact of future measures to improve earnings to be taken by investee companies are not taken into account.
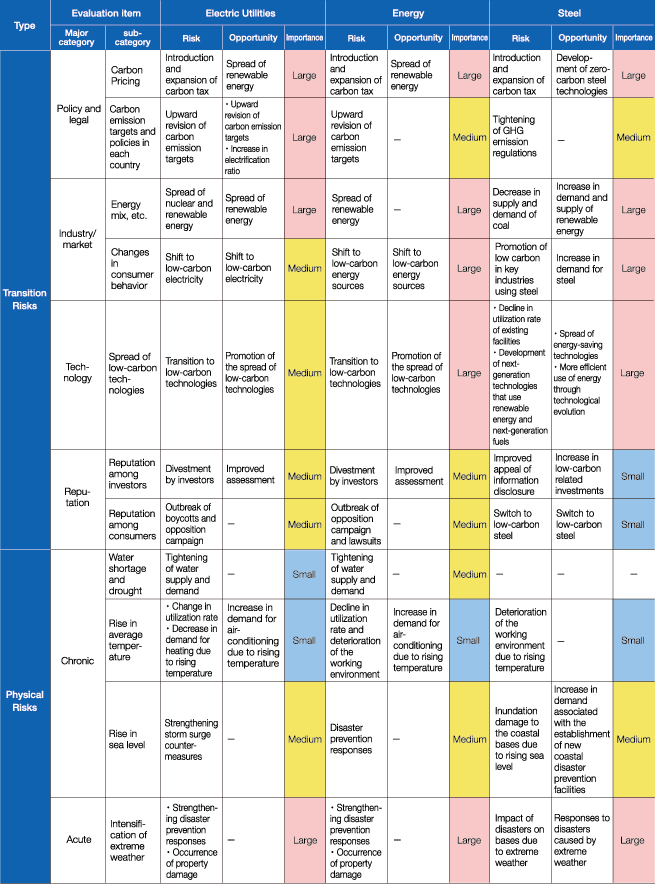
(2) Impact analysis on investment income focusing on key sectors
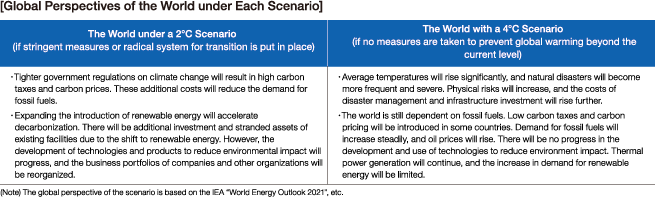
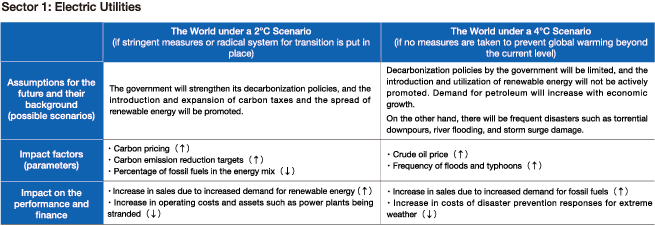
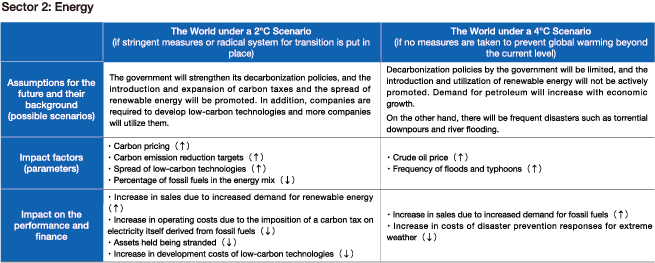
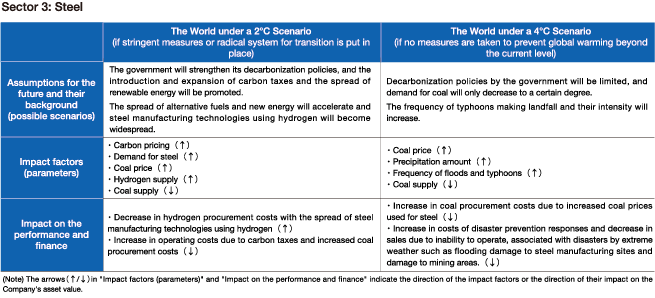
We analyzed the impact of 2℃ and 4℃ scenarios (*) on the following three sectors: electric utilities, steel, and energy, which were selected as the most important sectors that have a large impact on climate change and in which we have a large amount of investments and loans. As a result, we found that the introduction of a carbon tax, the spread of renewable energy, and other social changes may have a significant impact on the performance and finance of each sector under the 2℃ scenario.
We will conduct engagement with investees in these sectors, taking the results of the analysis into full consideration. We will hold dialogues with investees regarding the specific impacts indicated by the analysis and encourage them to take action to improve our investment performance.
(*) References are made to scenarios from the IEA "World Energy Outlook," IEA reports, and "Synthesis Report on Observations, Projections, and Impact Assessments of Climate Change (2018): Climate Change and Its Impacts in Japan" from the Ministry of the Environment, et al.
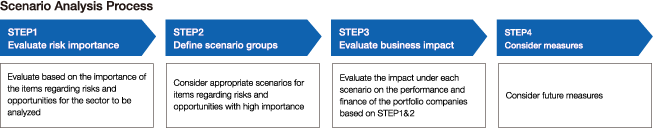
≪ STEP 1 ≫Evaluation of the importance of risks and opportunities by key sector
We evaluated the importance of risks and opportunities in three sectors that are important to the Company, based primarily on a survey of literature published by international organizations and other institutions, with assistance of outside experts.
≪ STEP 2 , STEP 3 ≫Impact on key sectors
In STEP 2 , we assume specific situations under the 2℃ scenario and 4℃ scenario (*) for items of risks and opportunities with high importance by key sector identified in STEP 1 . In STEP 3 , we qualitatively evaluate their impact on the performance and finance of the portfolio companies.
- (*)
- These scenarios are based on the Scenarios in "World Energy Outlook" of IEA, IEA reports, "Synthesis Report on Observations, Projections and Impact Assessments of Climate Change, 2018, Climate Change in Japan and Its Impacts," Ministry of the Environment and other ministries.
Click on the image to open the zoom-in version in a new window.
≪ STEP 4 ≫Measures
For investee companies in key sectors, we aim to enhance our medium- to long-term asset management results by engaging in constructive dialogue (engagement) that fully takes into account the specific impacts identified in our scenario analysis. Through this engagement, we will confirm the status of investees' response to these specific impacts and encourage decarbonization initiatives.
(3) Analysis on the impact of carbon cost on investee companies
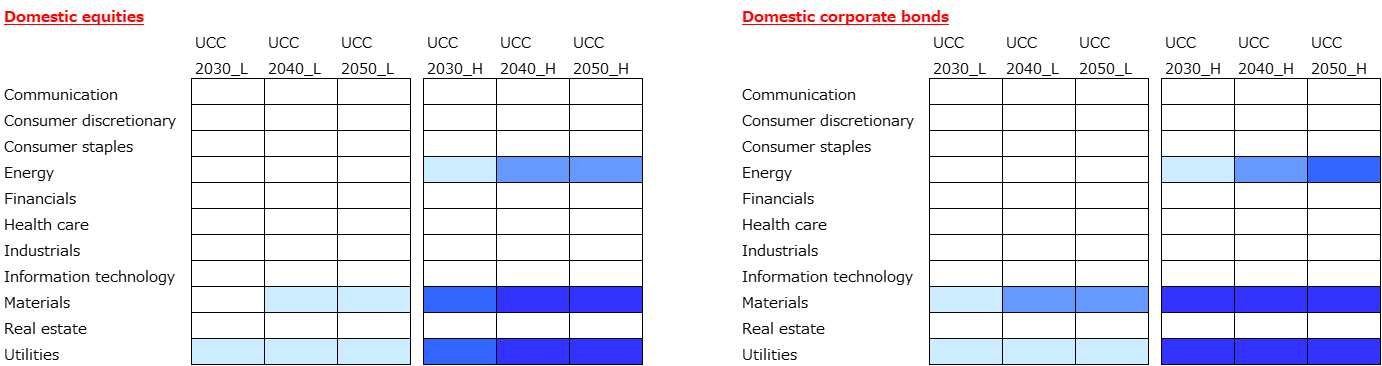
Presently, in Japan, the discourse on carbon pricing is progressing through platforms like the GX Implementation Council. As we transition to a decarbonized society, investee companies could be impacted by higher carbon costs as a result of carbon pricing, e.g., the introduction of carbon taxes by national governments. Therefore, with respect to our domestic/overseas equity and corporate bond portfolio, we analyzed the impact of higher carbon costs on the finances of investee companies based on two scenarios.
(i) Scenarios and Assumptions for Cost of Carbon
For the scenarios, which represent assumptions about carbon costs, we used the Unpriced Cost of Carbon (UCC) by S&P Trucost. UCC is based on sources such as carbon pricing scenarios from the IEA. Taking account the attributes of the region and sector in which the company operates, and assuming that its greenhouse gas emissions remain constant at the current level, it estimates the additional carbon costs that will be borne by the company at future point in time. For our analysis, we used two scenarios: low carbon price and high carbon price.
| Scenarios | |
|---|---|
| Low carbon price scenario | A scenario in which the countries fully implement their Nationally Determined Contributions (NDCs) under the Paris Agreement. |
| High carbon price scenario | A scenario in which temperature change in 2100 is below 2°C, consistent with the Paris Agreement, through appropriate policy implementation by national governments. |
(ii) Analysis Results
Using EBITDA (earnings before interest, tax, depreciation, and amortization) as a corporate financial indicator, we calculated the ratio between UCC and EBITDA for each asset class and each sector in 2030, 2040, and 2050. When this ratio is higher, it suggests that the company's financial situation is more fragile. The colored areas of the chart indicate that UCC is 25% or more of EBITDA, and the darker the color, the higher the ratio is.
For all asset classes, carbon costs have a big impact on the finances of companies in three sectors: energy, materials, and utilities. In particular, it can be inferred that under the high carbon price scenario (H), which assumes that aggressive policies will be implemented to promote decarbonization, the financial risks in these sectors could be high.
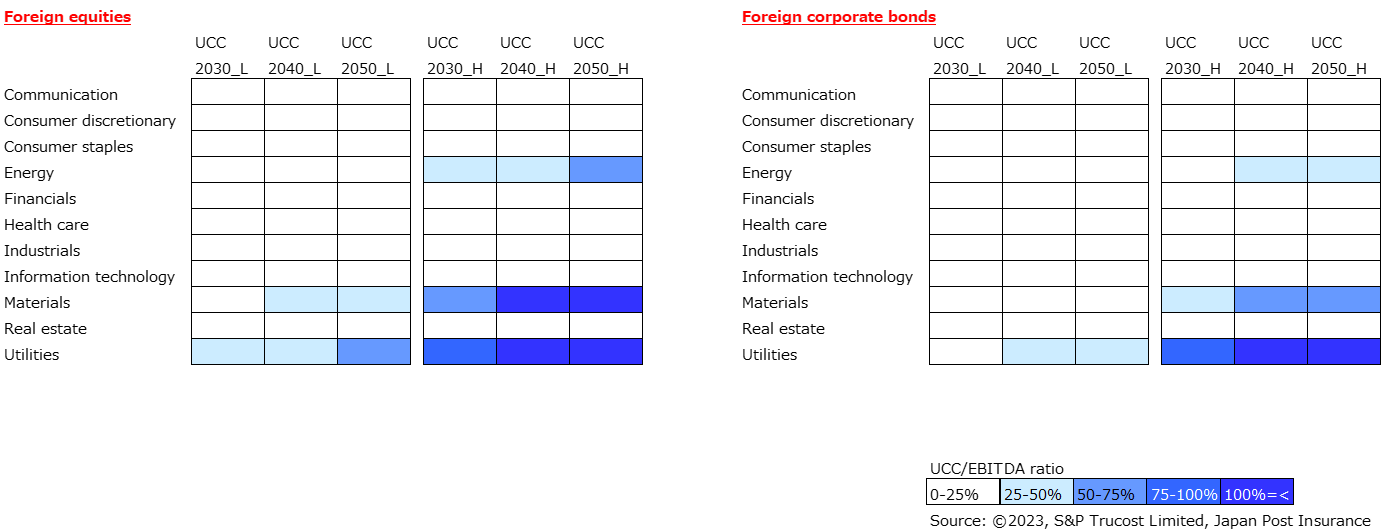
(iii) Our Plan
We will continue, through our engagement activities, to encourage companies, especially ones in these sectors where the potential financial impact is significant, to transition to decarbonization, and by supplying funds for a broad range of corporate decarbonization activities, we will endeavor to mitigate the climate risk of our portfolio.
- (*)
- Note that this analysis employs simplified simulations that are calculated using current EBITDA and GHG emissions and based on assumed carbon costs. It does not take into account variable factors such as future changes in the economy and business environment or policy responses, and the financial impact on investees could be significantly different as a result.
Decarbonization initiatives
We will implement initiatives related to the transition to a low-carbon society as an operating company and an institutional investor to achieve carbon neutrality and enhance the resilience of our business.
Initiatives as an operating company
To reduce GHG emissions from our business operations, we are promoting environmental conservation efforts with our facilities and vehicles, and by employees.
●Energy conservation and use of renewable energy in facilities and vehicles
In our offices, we are working to reduce energy consumption by improving the operation of lighting and air conditioning systems and introducing energysaving equipment. Our locations, Otemachi Place Tower and some other offices, use electricity generated from renewable energy sources, thereby contributing to the reduction of CO2 emissions. We are also striving to reduce CO2 emissions by gradually introducing eco-friendly vehicles such as hybrid vehicles to the fleet of those used in our operations.

Initiatives as an institutional investor
We have clarified our basic concept on climate change in our Sustainable Investment Policy and are taking the following actions in order to promote the decarbonization of our investment portfolio.
●Implementation of ESG integration
We have introduced ESG integration, in which sustainability factors are considered in addition to financial information when making investment decisions for all assets under management. For sectors with particularly high GHG emissions, we comprehensively evaluate the status of the investee's efforts to address climate change and incorporate this into our decision-making process when making investments and loans. With regard to negative screening, which excludes specific sectors from the scope of investment, we do not invest in new domestic or foreign project finance related to coal-fired power generation, which has high GHG emissions and is feared to have an impact on climate change.
●Implementation of stewardship activities
We place a high priority on addressing climate change in our Stewardship Activities Policy.
・Engagement with investees
In addition to domestic equities and domestic corporate bonds, we also engage in dialogue on climate change initiatives with respect to other assets under our management, taking into account the characteristics of each asset. We also participate in engagement initiatives and actively engage in collaborative engagement.
Guidelines for electrical power sector
The emission intensity (g-CO2/KWh) standard that the electrical power sector should aim for by 2030 is as follows:
195 to 270 g-CO2/kWh
This standard was formulated based on the Net Zero Emissions by 2050 scenario (NZE scenario) and the Announced Pledges scenario (APS scenario) set out in the World Energy Outlook 2024 release by the International Energy Agency (IEA). The standard that we use will be revised accordingly in response to any changes in the external environment or updates to the aforementioned scenarios.
If the situation does not improve despite ongoing dialogue, we will consider escalation.
・Response through shareholder voting
Our Policy on Exercise of Shareholder Voting Rights state that, in principle, we will oppose the election of internal and outside directors and auditors who are deemed responsible for events that have a serious impact on the environment. In addition, we judge shareholder proposals on environmental issues from the perspective of maximizing long-term shareholder profits and the degree of environmental impact.
- Policy on Stewardship Activities
- External Evaluation and Support for Initiatives
- Standards for the Exercise of Shareholder Voting Rights (in Japanese)
●Measurement and management of GHG emissions from the investment portfolio
We measure the GHG emissions of our investment portfolio annually. Based on the results of this analysis, we manage our investment portfolio to achieve our GHG emissions reduction targets.
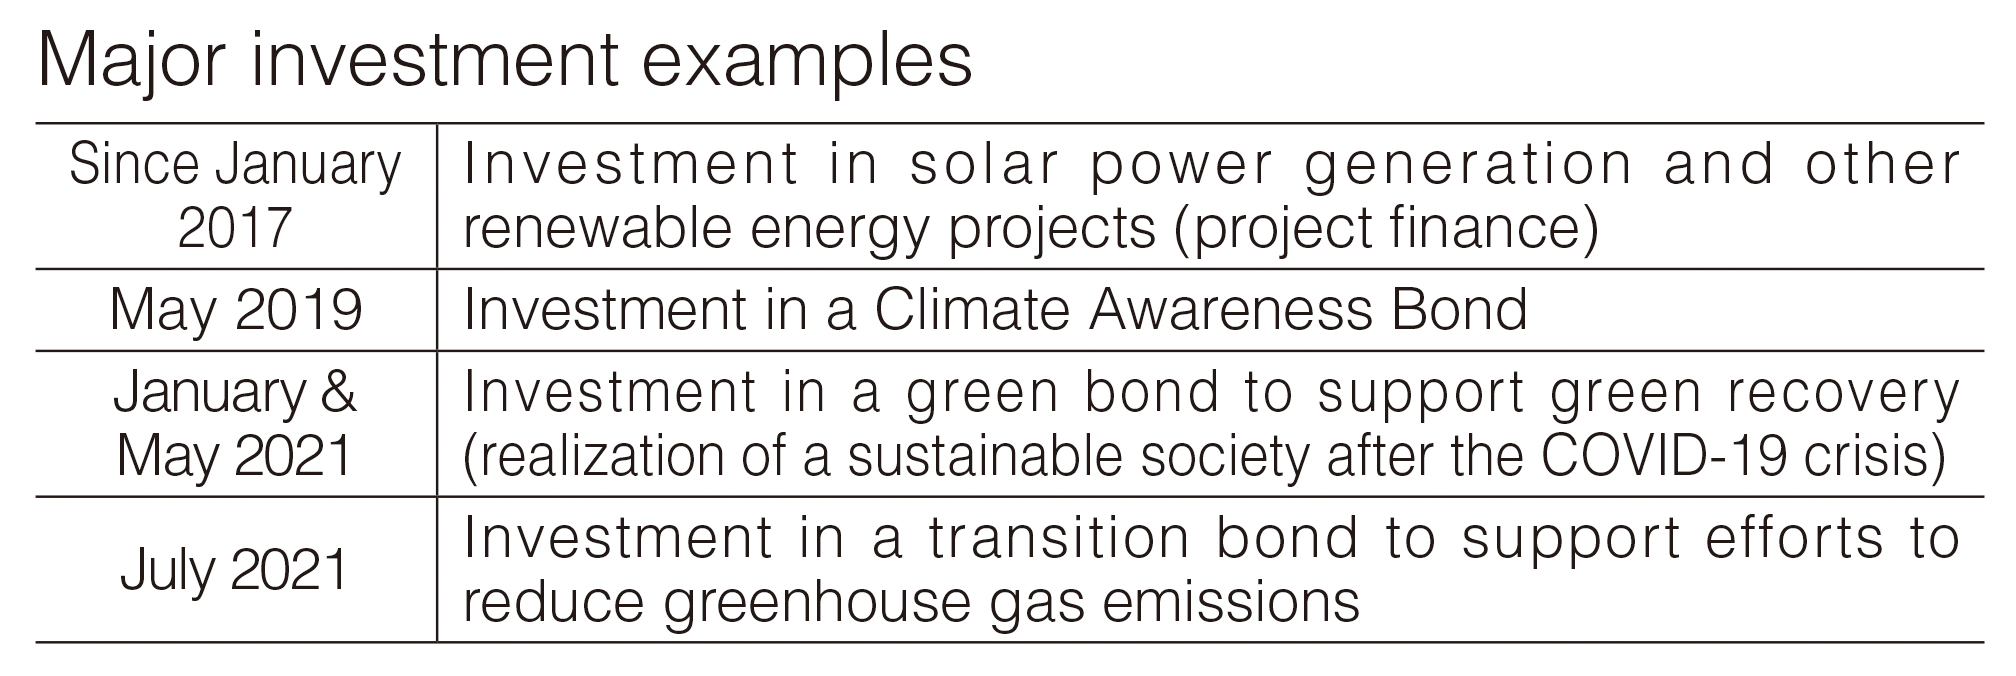
●Promoting investments that contribute to the decarbonization of society
We are actively making investments that contribute to the decarbonization of society to promote the decarbonization of society. In addition to providing funds to the green finance market, we are actively pursuing investments in renewable energy.
Adaptation for climate change impacts
●BCP Response
We have formulated a business continuity plan (BCP) in preparation for the occurrence of a large-scale disaster, including initial responses in the event of a disaster and a plan to continue business activities at another site in the event that the functions of an important site are suspended. In addition, we assess the risk level of our business sites and business areas based on hazard maps, etc., and formulate response plans and conduct drills as appropriate for sites located in areas that are particularly vulnerable to flood damage.
Risk Management
The Company has established a system to identify and assess climate change risks on a company-wide basis (*), with the Sustainability Promotion Department in charge of risk assessment and the Risk Management Department in charge of overall risk management, and reports the results to the Risk Management Committee. Going forward, we will continue to identify and assess climate change risks at least once a year, continue and upgrade scenario analyses, and sophisticate a climate change risk management system. These results were also reported to the Sustainability Committee as part of our efforts to address climate change.
(*) The identification and assessment of climate change risks covers all risk categories managed by the Company and takes into account upstream and downstream activities in addition to our own business operations.
Metrics and Targets
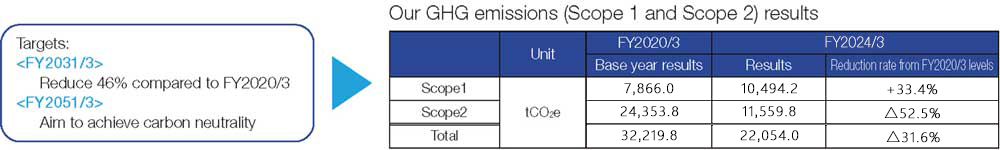
Metrics and Targets as an Operating Company
We have set the following greenhouse gas emissions (GHG emissions) reduction targets for Scope 1 (direct emissions from the company) and Scope 2 (emissions associated with the use of electricity and other resources supplied by other companies) (excluding increases due to new business), and are working toward achieving carbon neutrality. So far, we have reduced emissions by 33.6% as of the end of FY2024 through the use of electricity generated from renewable energy sources at large facilities occupied by the Company.
(*) With the transition to the new Japan Post Insurance sales system in April 2022, the measurement scope for FY2019 emissions was retroactively revised, and the values were updated accordingly.
Supply chain emissions (Scope1, Scope2, Scope3)
Supply chain emissions refer to the sum of all emissions related to business activities, not just those of the business itself.
In other words, it refers to the amount of greenhouse gas emissions generated from the entire process of procuring raw materials, manufacturing, distribution, sales, and disposal.
Supply chain emissions = Scope1 emissions + Scope2 emissions + Scope3 emissions
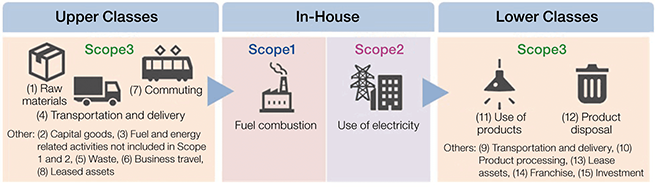
- Scope1:
- Direct emissions of greenhouse gases by the business itself (fuel combustion, industrial processes)
- Scope2:
- Indirect emissions from the use of electricity, heat and steam supplied by other companies
- Scope3:
- Indirect emissions other than Scope1 and Scope2 (emissions of other companies related to the activities of the business)
Prepared by Japan Post Insurance Co. Ltd. based on the Green Value Chain Platform (Ministry of the Environment)
(https://www.env.go.jp/earth/ondanka/supply_chain/gvc/estimate.html)
Metrics and Targets as an Institutional Investor
GHG emissions metrics for our investment portfolio
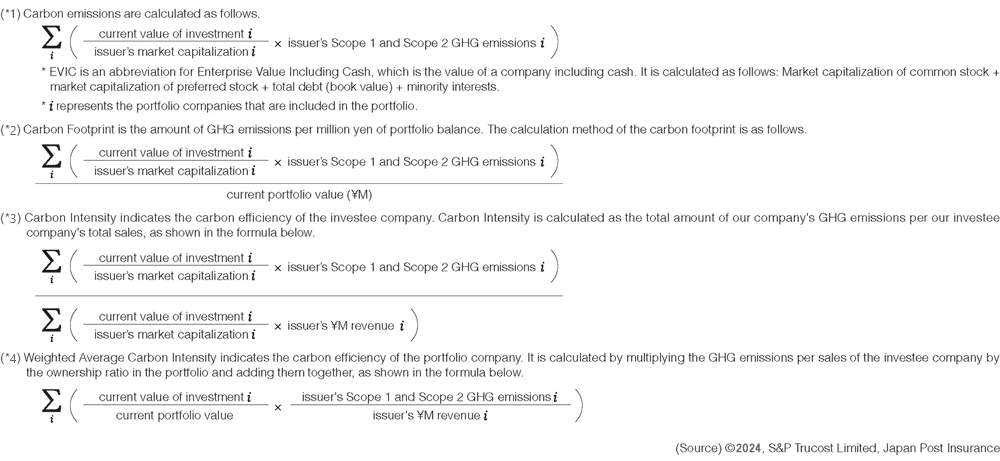
To assess climate-related risks and opportunities, our company has been measuring GHG emissions metrics (GHG emissions, carbon footprint, carbon intensity, and weighted average carbon intensity) for our investment portfolio (domestic and foreign equities, and domestic and foreign corporate bonds (including corporate financing))(*) since FY2020 (as of March 31, 2021). The measurement results for FY2023 (as of March 31, 2024) are as follows. Additionally, we have implemented measurements for other assets. For more details, please refer to our Responsible Investment Report.
The scopes covered in the carbon emissions calculation are direct emissions of greenhouse gases by investee companies (Scope1), indirect emissions from purchased electricity (Scope2), and emissions from supply chains other than purchased electricity (Scope3). The calculation of the carbon footprint, carbon intensity and weighted average carbon intensity covers Scope1, Scope2, and emissions from direct suppliers of Scope3.
- (*)
- Includes not only internally managed assets but also externally managed assets.
GHG emissions metrics by asset class
| Emission-related indicators Measurement range Unit |
Carbon emissions(*1) Scope1&2 (tCO2e) |
Carbon emissions(*1) Scope1&2+direct supplies of Scope3 (tCO2e) |
Carbon emissions(*1) Scope1&2&3 (tCO2e) |
||||
|---|---|---|---|---|---|---|---|
| Asset Class | As of March 31, 2024 | As of March 31, 2025 | As of March 31, 2024 | As of March 31, 2025 | As of March 31, 2024 | As of March 31, 2025 | |
| Domestic equities | 1,763,185 | 1,767,782 | 2,752,655 | 2,728,147 | 4,500,812 | 4,433,374 | |
| Foreign equities | 264,768 | 248,633 | 353,588 | 316,537 | 479,534 | 425,060 | |
| Domestic corporate bonds | 4,362,862 | 3,993,876 | 5,082,031 | 4,589,138 | 5,751,539 | 5,209,706 | |
| Foreign corporate bonds | 1,440,332 | 1,389,361 | 1,744,254 | 1,665,688 | 2,177,547 | 2,177,214 | |
| Total | 7,831,148 | 7,399,652 | 9,932,529 | 9,299,511 | 12,909,432 | 12,245,354 | |
| Emission-related indicators Measurement range Unit |
Carbon Footprint(*2) Scope1&2+direct supplies of Scope3 (tCO2e/million yen) |
Carbon intensity(*3) Scope1&2+direct supplies of Scope3 (tCO2e/million yen) |
Weighted average carbon intensity(*4) Scope1&2+direct supplies of Scope3 (tCO2e/million yen) |
||||
|---|---|---|---|---|---|---|---|
| Asset Class | As of March 31, 2024 | As of March 31, 2025 | As of March 31, 2024 | As of March 31, 2025 | As of March 31, 2024 | As of March 31, 2025 | |
| Domestic equities | 0.76 | 0.72 | 1.37 | 1.10 | 1.12 | 0.85 | |
| Foreign equities | 0.45 | 0.38 | 0.58 | 1.45 | 1.34 | 1.18 | |
| Domestic corporate bonds | 2.53 | 2.16 | 5.45 | 4.01 | 4.72 | 3.21 | |
| Foreign corporate bonds | 0.77 | 0.71 | 2.43 | 1.09 | 2.46 | 2.07 | |
| Total | 1.15 | 1.02 | 2.57 | 1.73 | 2.33 | 1.75 | |
Of the GHG emissions in our investment portfolio, our Scope 1 and 2 emissions totaled roughly 7.39 million tCO2e, a decrease of approximately 0.43 million tCO2e from the previous fiscal year. Furthermore, the combined total of Scope 1, 2, and 3 emissions was roughly 12.24 million tCO2e, a decrease of approximately 0.66 million tCO2e from the previous fiscal year. The reduction of Japanese corporate bonds contributed to a decrease of roughly 0.54 million tCO2e to this total. When calculating GHG emissions metrics, recording Scope 3 emissions as GHG emissions requires us to take note of the issue of double counting (for example, Scope 1 emissions for some companies correspond to Scope 3 emissions for others). However, when recording this year's measurements, we placed importance on identifying as wide a range of emission conditions as possible throughout the supply chain, including Scope 3 emissions.
It is important to note that we recognize including Scope3 in the calculation of GHG emissions may occur double counting (e.g., Scope1 emissions of one company may correspond to Scope3 emissions of another company). Despite this problem, we chose to widen the scope to supply chains to understand our portfolio emissions as much as possible.
■GHG emissions composition of our investment portfolio by sector (Scope 1&2)
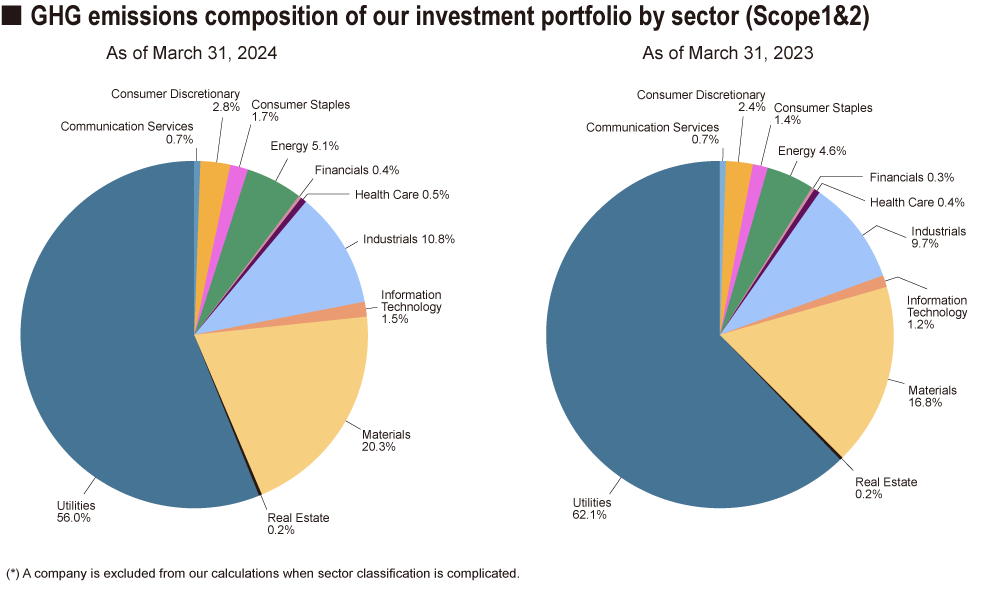
- (*)
- A company is excluded from our calculations when sector classification is complicated
■Total portfolio weighted average carbon intensity sector composition
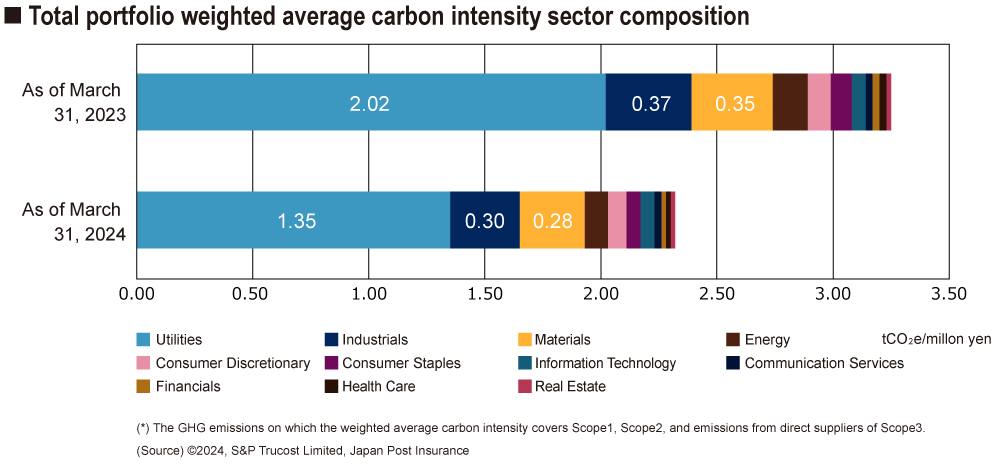
- (*)
- The GHG emissions on which the weighted average carbon intensity covers Scope1, Scope2, and emissions from direct suppliers of Scope3. (Source)©2024, S&P Trucost Limited, Japan Post Insurance
GHG emissions reduction targets for our investment portfolio
As an institutional investor, we have set targets for the GHG emissions from our investment portfolio, aiming for carbon neutrality by 2050, and working toward a 50% reduction in greenhouse gas emissions from FY2020 levels by FY2029 (March 31, 2030), as an interim target. Our 2050 target and interim target are based on the IPCC's Special Report* and align with the Paris Agreement and the long-term targets of the Government of Japan.
By reflecting the various factors of our climate change response aimed at achieving these targets in our investment strategy, we aim to realize a carbon-neutral society and enhance our medium- and long-term asset management results.
- *
- IPCC (2018) Global Warming of 1.5°C an IPCC special report on the impacts of global warming of 1.5°C above pre-industrial levels and related global greenhouse gas emission pathways, in the context of strengthening the global response to the threat of climate change, sustainable development, and efforts to eradicate poverty
| Type of emission | Category | Reduction targets | |
|---|---|---|---|
| Interim target | 2050 | ||
| Emissions from our investment portfolio (*1) | Scope3 Category 15 |
50% reduction in greenhouse gas emissions from FY2020 levels by the end of FY2029 (*2) | Net zero |
- (*1)
- Total emissions of Scope 1 and Scope 2 from investee companies (domestic and foreign listed equities and credits including corporate loans) after calculating by the ratio of our holdings.
- (*2)
- We aim for a 50% reduction, measured as of March 31, 2030, compared to GHG emissions from our investment portfolio as measured on March 31, 2021.